
spotlight
spotlight

IllumiCare launches Spotlight App to reduce provider costs and improving hospital operations


Chicago-Area Health System Puts Spotlight on Identifying and Managing High Costs


PROVIDER COST ATTRIBUTION AND INSIGHTS
PROVIDER COST ATTRIBUTION AND INSIGHTS
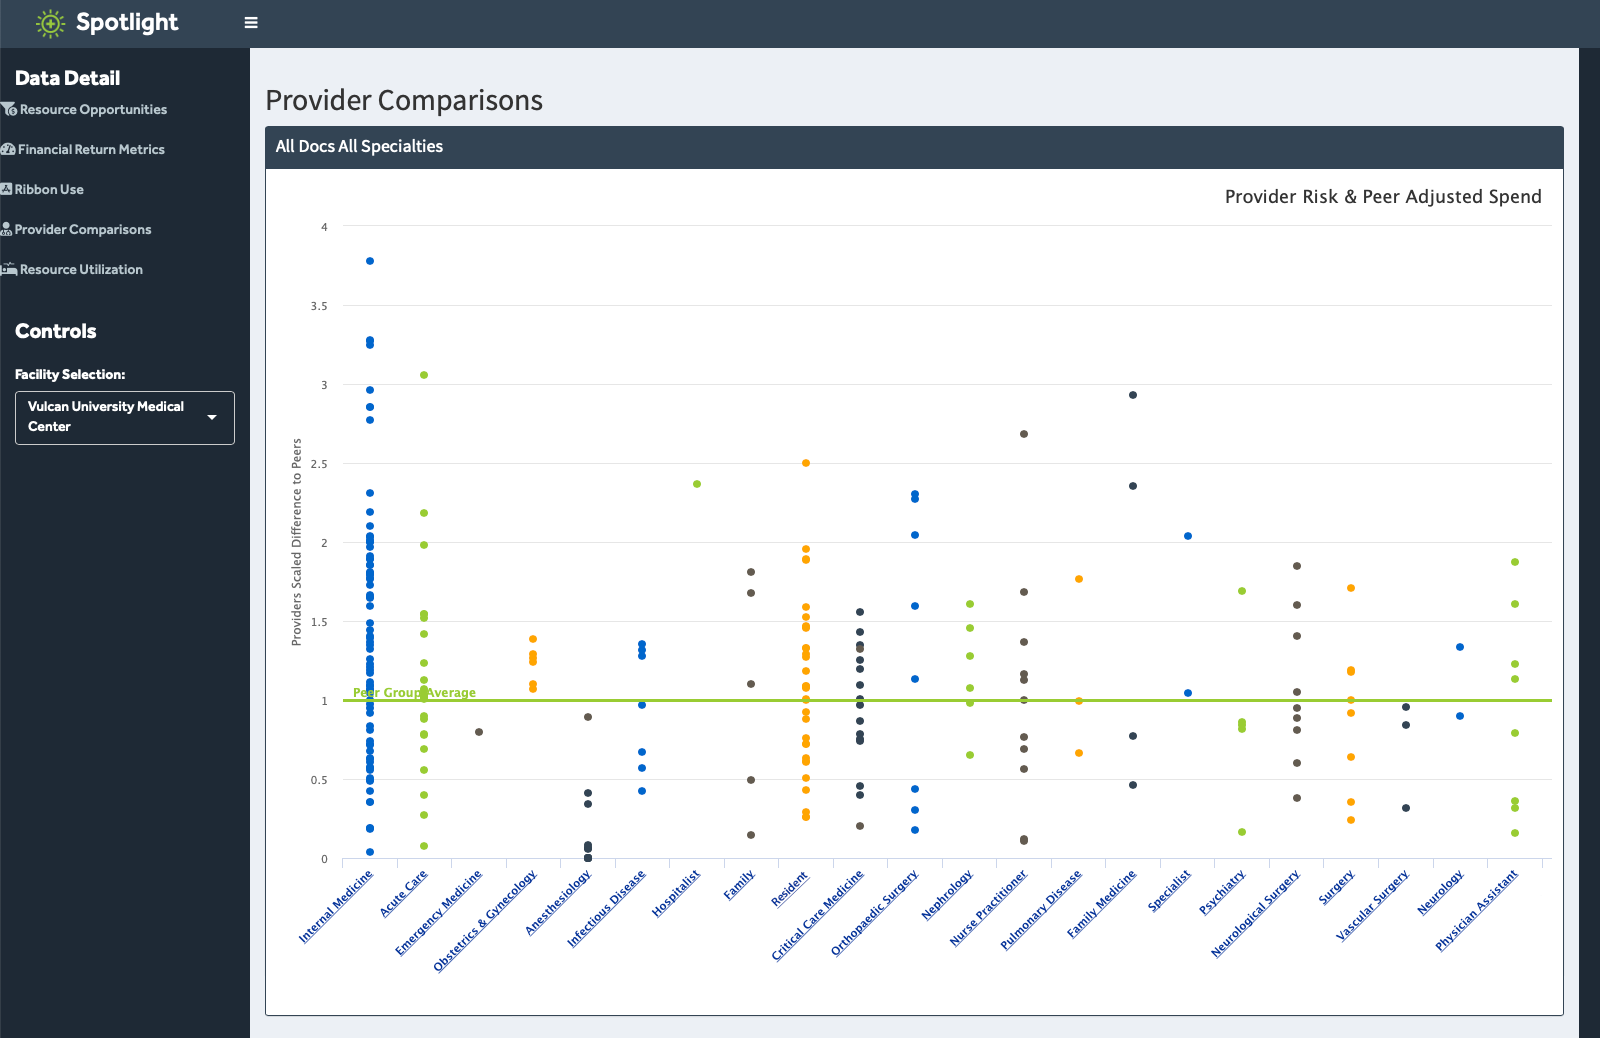
IllumiCare knows your cost (not charge) of every med/lab/rad order, the ordering provider, their specialty and the acuity of the patient. We attribute costs to each responsible provider (not just to the admitting or discharging provider). And, it all happens in real-time.
What emerges from this analysis is a view of practice pattern variation among providers of the same type that drives over-utilization and higher costs. This data is directly available to you via upload into your existing Decision Support / BI system, or managers and leaders can directly interact with it in an easy-to-use tool we call Spotlight.
Who?
- Which specialities account for the biggest variation?
- Which providers within each specialty are outliers (risk-adjusted)?
- Which providers are the best stewards of resources?
What?
- What are the biggest
opportunities for cost improvement?
- What specific behaviors drive the overspending of outliers (risk-adjusted)?
- In what DRGs do we struggle against internal benchmarks and why?
Where?
- Which facilities in our system are over/under performing?
- Where is IllumiCare changing behaviors?
- Where are we seeing lower cost as a result?
FROM THE MACRO TO THE MICRO VIEW
FROM THE MACRO TO THE MICRO VIEW
Spotlight answers four main questions:
- Who is it that drives excess cost and utilization and why?
- What are the biggest opportunities for improvement, and do they require a targeted or broad intervention?
- Who is using the IllumiCare Ribbon and how?
- Is our risk-adjusted cost per admission changing and why?
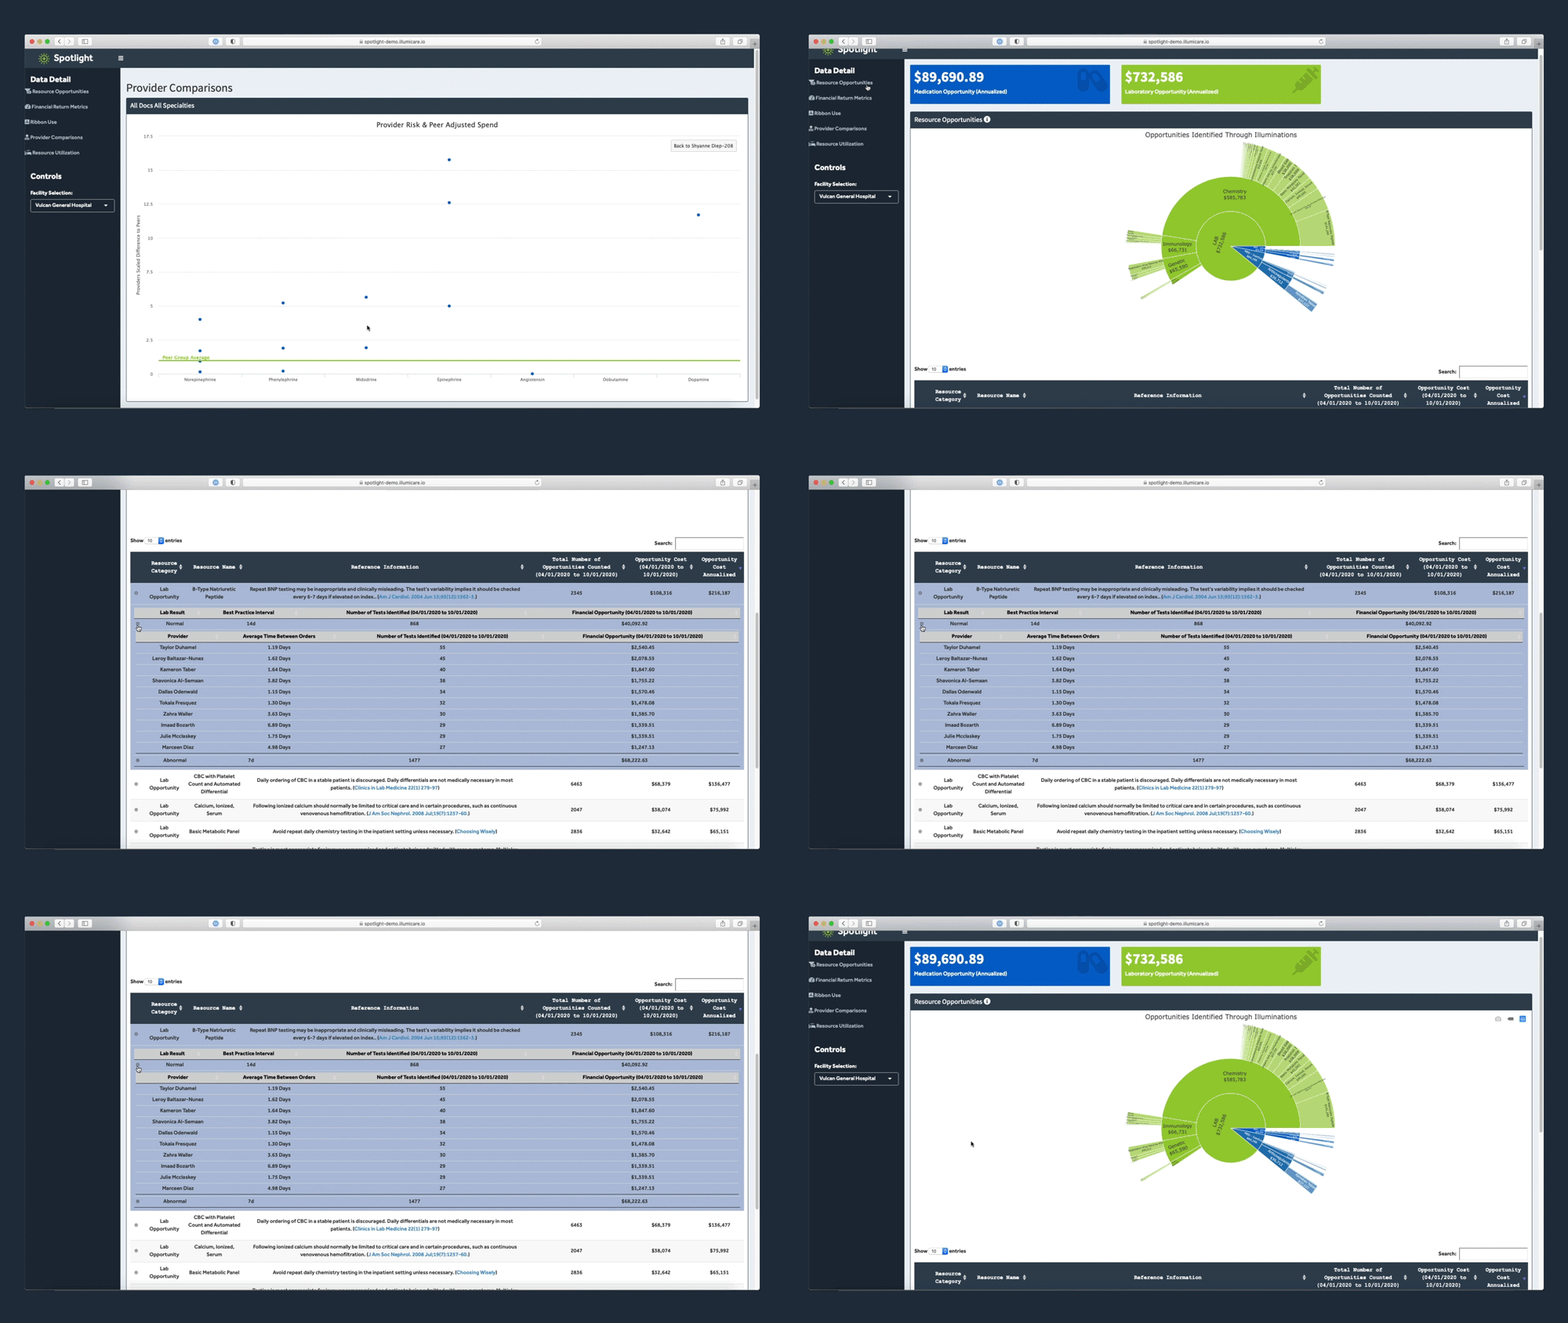
The answers to these questions are made accessible in a web-based tool that requires no special training. It is intended for managers and leaders to easily explore their own data. Of course, IllumiCare is a comprehensive service that includes training and guided data exploration – so you never have to feel separated from the insights that can drive operational improvements.


If you’re curious how Spotlight might benefit your organization, let’s chat. 205.578.1738
Smart Ribbon®

IT'S A PLATFORM TO DO SO MUCH MORE
As an EMR-agnostic platform of apps that automatically appears on the same screen and with patient context, it gives power back to clinicians to control their workflows, improve cost/quality and bring some joy back to clinical practice.
Smart Ribbon®

IT'S A PLATFORM TO DO SO MUCH MORE
As an EMR-agnostic platform of apps that automatically appears on the same screen and with patient context, it gives power back to clinicians to control their workflows, improve cost/quality and bring some joy back to clinical practice.


