


-
Overview
-
Screenshot
-
Video - Stewardship Overview
-
Video - Training
-
FAQs
REAL-TIME COST TRANSPARENCY
We ask for “value-based care” but how are providers supposed to make value judgments if they don’t know what things cost? The Stewardship App teaches and reinforces a value mindset by exposing real hospital costs to providers and nudging in their clinical workflow when lower cost opportunities exist, supplemented with clinical guidance and citations. The result is an average of $86+ per admission in hard-dollar savings, adding up to millions of dollars.
ATTRIBUTED TO THE RESPONSIBLE PROVIDER
The app uses your own wholesale acquisition cost for medicines and your direct, variable cost accounting data for labs to give a true representation to providers of what things cost. More importantly, we know the cost of every order, by every provider, the provider specialty and the patient’s acuity. From that, we understand variation in practice patterns among similar providers. We use machine learning to turn our understanding of each provider’s practice tendencies into personalized contextual education. Content is delivered to the right provider at the right time…but not too often.

What timers can be seen and what are they?
The following timers will be displayed based on the patient’s current patient class/type: Inpatient (Length of Stay based on patient days), Observation (length of time patient has been on observation status), and ED (time since the patient checked in).
How is C Diff % Risk calculated?
This is the iatrogenic C Diff risk, related to current active scheduled medications. Our calculations consider the specific risk that exists for each specific antibiotic and/or protein pump inhibitor as well as the compounding affect that occurs when the patient has been prescribed multiple antibiotics and/or PPIs concurrently.
How is Fall Risk calculated?
The fall risk represents the relative risk of falling based on the intake of scheduled sedatives and opioids if aged 65 or greater. Please note, this calculation only considers current scheduled medications. Medications prescribed as PRN are not currently factored in as a part of this fall risk calculation.
What lab costs are displayed in the Stewardship app?
Lab costs derive from the Medicare Allowable Rate. The costs are not charges or what the patient pays.
How is blood loss calculated?
IllumiCare calculates the total phlebotomy blood draw that occurs based on the average amount of blood that must be drawn for each test ordered. We do consider other factors in our calculation, for example, when multiple lab tests are ordered at the same time, they may leverage the same blood draw.
What Rad costs are displayed in the Stewardship app?
Rad costs derive from the Medicare Allowable Rate. The costs are not charges or what the patient pays.
-
Overview
-
Screenshot
-
Video
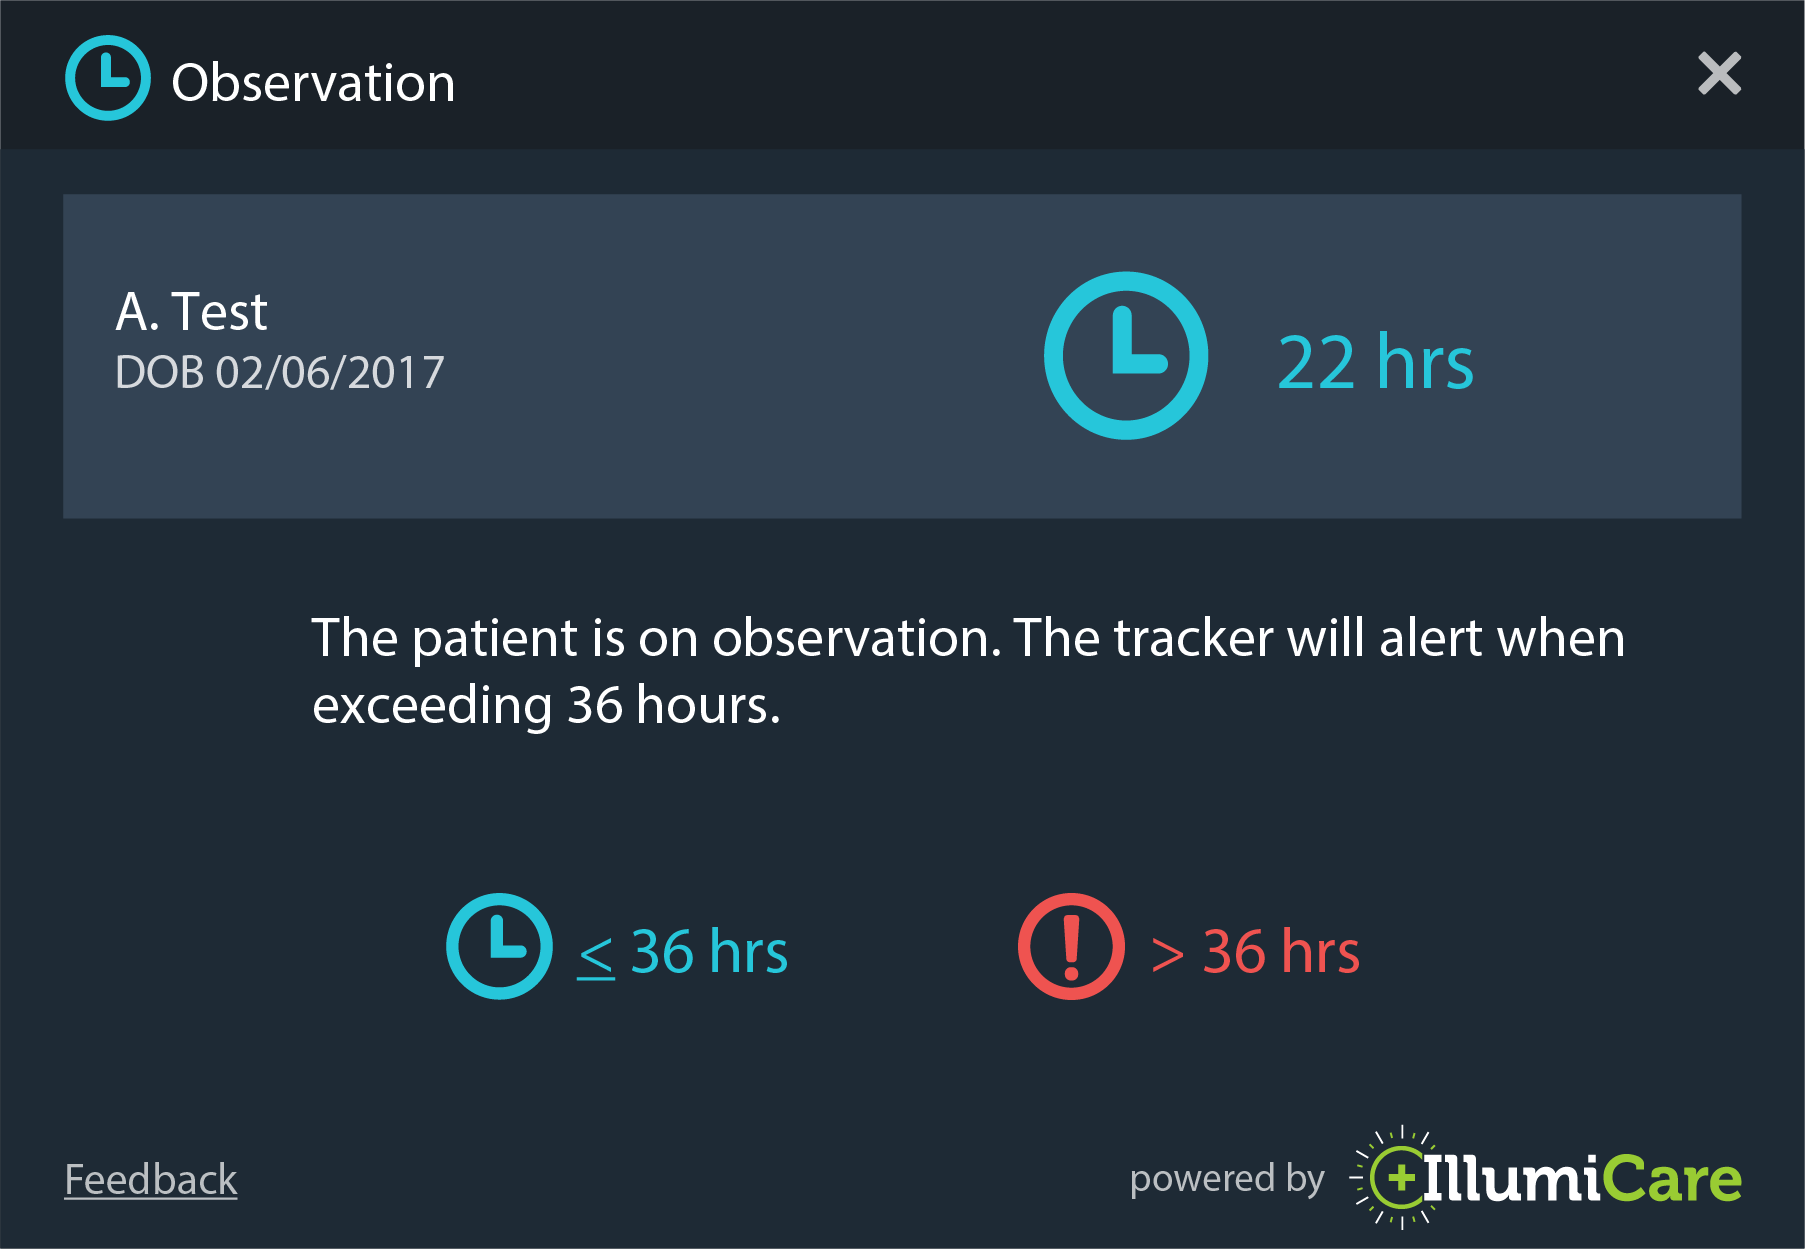
PATIENT SPECIFIC OBS CALCULATION
If a patient is on observation status, a timer will appear in the Smart Ribbon. The value represents the amount of time the patient has been on obs status. The numerical value will turn red after the patient exceeds the amount of time determined by your health system. The status will be displayed by a key performance indicator on the Ribbon icon. The icon will be the blue clock if the patient has not been on obs status longer than the limit set by the health system, otherwise it will be a red alert circle.
HOW IS OBS TIME CALCULATED?
The observation timer shows the current time a patient has been in an observation status. This is based upon the provider order to place them into the observation status.
WHY IS OBS TIME RED?
After 24 hours the Obs timer turns red to indicate that the patient is nearing the Two Midnight Rule. This is a visual reminder of the duration of time they have spent in that status.
-
Overview
-
Screenshot
-
Video
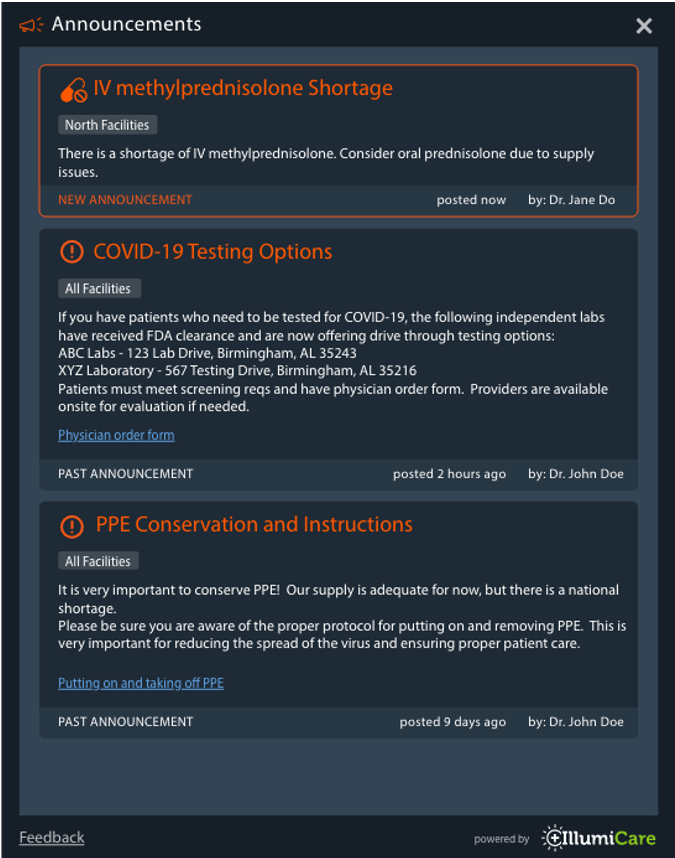
HIGH PRIORITY CLINICAL ANNOUNCEMENTS
Announcements are high priority clinical posts that may be relevant to specific facilities within your health system or relevant to your health system as a whole. New and past announcements are displayed on the home screen when you first open the app.
- Administrators may create, edit, save drafts, delete, and recover any announcements within their health system
- Calculated on every med, lab and radiology order
- Save as a 'Draft' and post at a later time
- Admins can edit already posted announcements
- Announcements appear on the ribbon with an illumination
- Post to individual regions within your health system
-
Overview
-
Screenshot
-
Video
-
FAQs
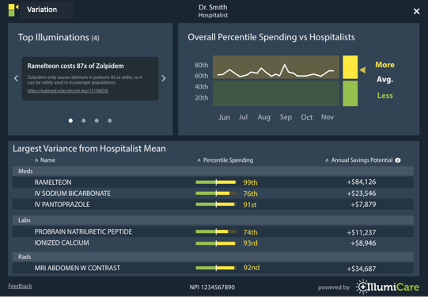
COMPARE SPENDING
The Variations App allows a provider to compare on a DRG-adjusted basis his/her real-time spending per admission with their specific sub group, and highlights specific opportunities for improvement. A physician’s moving average is also provided.
HOW IS MY CARE RISK ADJUSTED?
IllumiCare creates cohort of patients based upon their final DRG. This cohort methodology allows IllumiCare to compare the costs of patients within DRG groups such that the cohorts have similar acuity. Creating cohorts with homogeneous acuity and specialty provides a stable basis for comparing physician resource utilization.
HOW DO I KNOW WHAT IS GOOD?
A provider’s overall percentile, when compared with their peers, is presented in a run chart graph widget. The area in green means that cost outcomes were above the median of the group, while red means that costs were below the median. The higher the percentile, the lower the overall costs.
WHERE DOES MY VARIABILITY COME FROM?
IllumiCare details specific areas where a provider uses more resources than their peers in the incremental breakout of resource utilization. Areas such as medication category, imaging modality and lab are all detailed to show overall incremental cost difference over the last two months.
Coming Soon!
Who are my peers and how is my care risk adjusted?
Peer groups are established working with your administration and medical staff office. Utilizing your credentialed specialty and your patient care patterns your peer group was selected to ensure a homogeneous cohort. IllumiCare creates cohort of patients based upon their final DRG. This cohort methodology allows IllumiCare to compare the costs of patients within DRG groups such that the cohorts have similar acuity. Creating cohorts with homogeneous acuity and specialty provides a stable basis for comparing physician resource utilization.
How do I know what’s good?
The providers overall percentile, when compared with their peers, is presented in run chart graph widget. The area in green means that your cost outcomes were above the median of the group and the are in red means that your costs were below the median. The higher your percentile the lower your overall costs.
How do I see where my variability comes from?
IllumiCare details specific areas where a provider uses more resources than their peers in the incremental breakout of resource utilization. Areas such as medication category, imaging modality and lab are all detailed to show your overall incremental cost difference over the last two months. Selecting a category with a cost delta provides a view of the specific medications where your resource utilization differs from your peers.
Contacting IllumiCare support staff:
1st - Click the lightbulb on the right side of your ribbon to open the ribbon menu
2nd - Click Help & Support
3rd - Let our support staff know how they can help you.